Table of Contents
2025 Dental Market: $175B Opportunity, 10% Leakage
Executive Snapshot
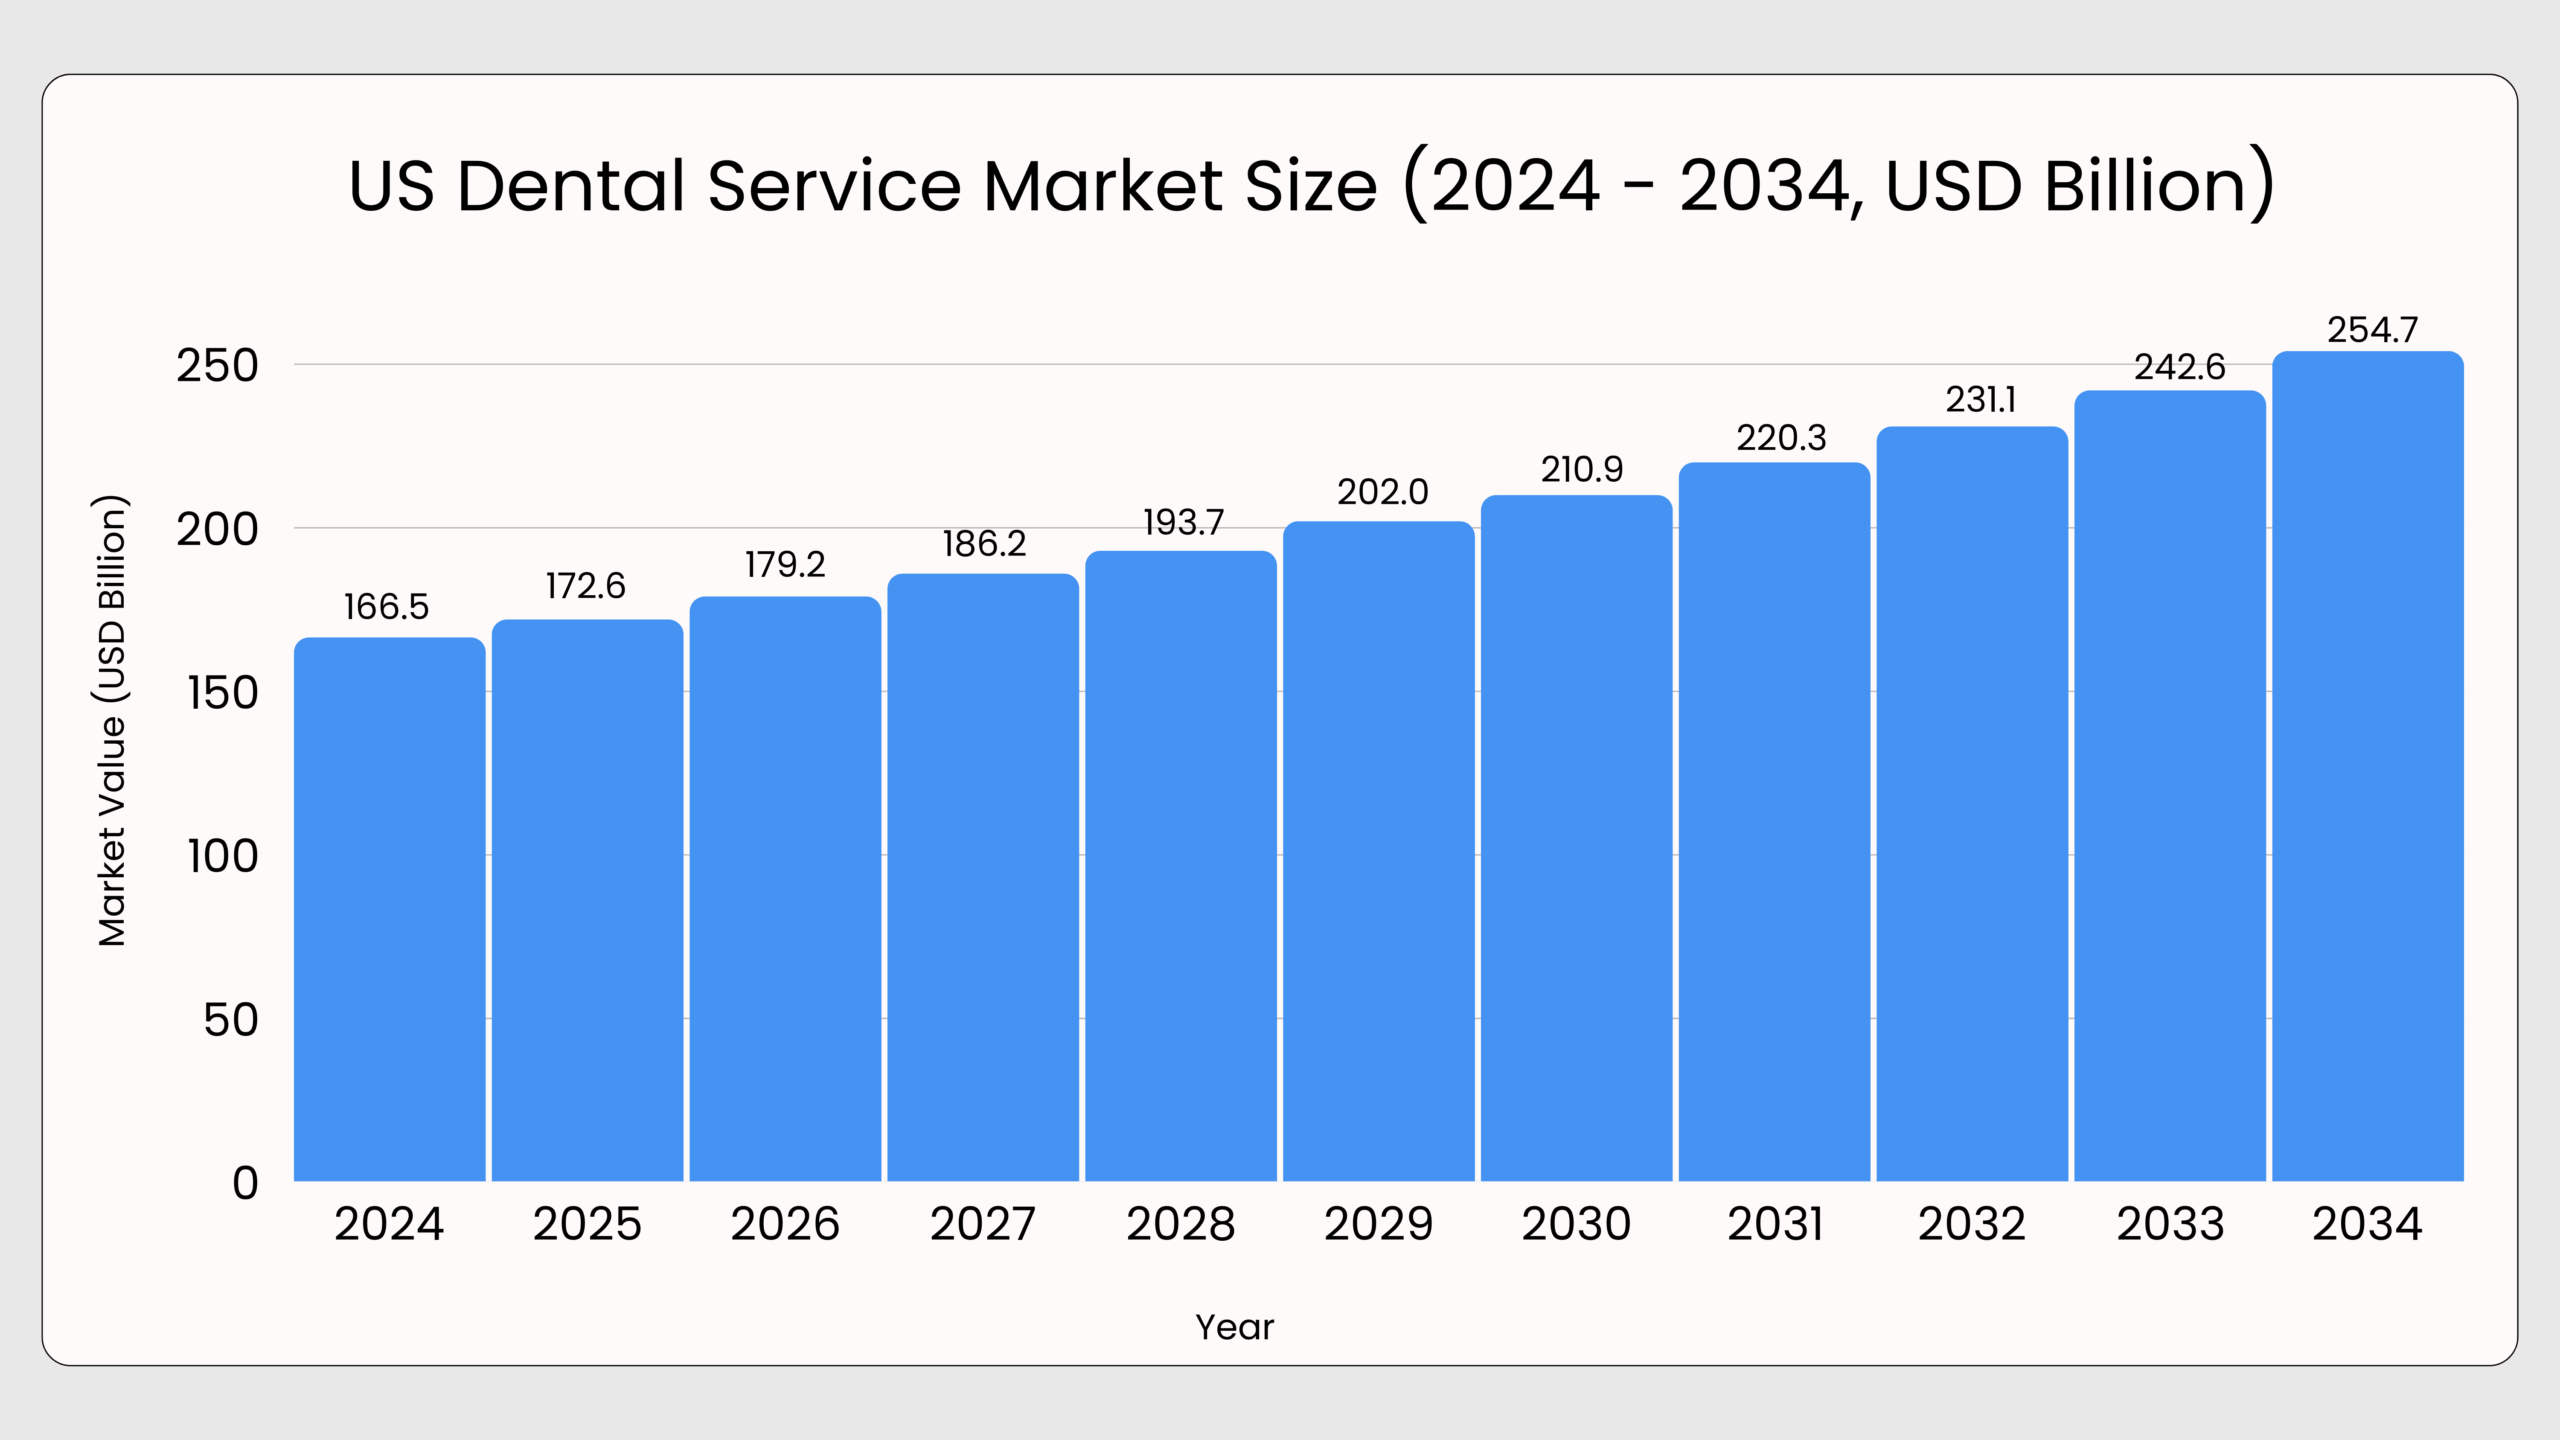
U.S. dental services market: $172–185B in 2025 → $211B by 2030 (4.4–5.3% CAGR)
DSOs growing 17.9% CAGR amid $77M raises and strategic partnerships, but integration costs slow scale.
Core friction: 56% treatment plans accepted → 46% completed (10% drop-off = $billions lost). 14.4% cancellations + 6.2% no-shows = “empty chair” crisis.
Tech paradox: $3.1B software spend (10.3% CAGR) but 5–7 fragmented tools leave eligibility errors, A/R drag unsolved.
Investor signal: “Tech stack standardization” now drives DSO valuations.
Opportunity: Unified platforms close care gaps, cut no-shows <10%, standardize DSO ops.
The Dental Services Market at a Glance (2025)
- U.S. Dental Services Market (2025): ~$172.6–$184.6B
- → Projected to reach $210.9B by 2030 (CAGR 4.4–5.3%)
- Global Dental Services Market (2025): $472.6B
→ Projected to reach $769.7B by 2034 (CAGR 5.1%)
Why this matters:
Dentistry is a large, growing, and operationally complex market where small efficiency gains translate into massive revenue impact.
Executive takeaway
This is a big, growing market and it’s increasingly worth optimizing.
Market Size & Growth Outlook
The dental sector continues to expand steadily, supported by demographic demand, insurance penetration, and growing consumer willingness to invest in oral health. Growth is not uniform across services or practice models, creating clear winners and laggards.
What’s Driving Revenue Today vs Tomorrow
Where money comes from now and where growth is headed
Specialty Mix: Stability vs. Growth
Latest Market Baseline (2024): Endodontics
- Root canals and pain-driven procedures
- Essential, non-deferrable care
- Predictable, insurance-backed revenue
Growth Outlook (2025–2034): Cosmetic Dentistry
- Whitening, veneers, aligners, smile design
- High out-of-pocket spend
- Strongly influenced by patient experience and trust
What this signals
Future growth depends less on clinical necessity alone and more on patient education, communication, and confidence in care decisions.
Practice Models Are Shifting
Who is delivering care is changing
Practice Structure Evolution
Latest Market Baseline (2024)
- Independent dental clinics and private practices remain the backbone of U.S. dentistry
- Highly fragmented, owner-operated landscape
Fastest-Growing Model (2025–2034): DSOs
- Centralized operations
- Standardized workflows
- Faster technology adoption
- Stronger recruitment and scalability
What this signals
Whether independent or DSO-backed, operational consistency and technology leverage are becoming table stakes.
DSO Growth Patterns & Strategic Drifts (2025)
Drift #1 – DSOs Have Outgrown Aggregation
- Recent deals show investors doubling down on DSOs and specialty platforms to fuel growth, roll-ups, and operational scale.
- June 2025: Southlake-based Allied OMS raised a minority growth investment to broaden its service mix, accelerate integration work, and support acquisitions. Led by 65 Equity Partners, with participation from Everberg Capital.
- April 2025: Max Surgical Specialty Management (Hackensack, NJ) secured ~USD 77M to expand its oral and maxillofacial surgery platform across the Northeastern U.S.
- March 2025: Silver Creek Dental Partners (California) arranged a debt financing facility with Ivy Asset Group to fund practice investments and statewide expansion.
Drift #2 – Strategic Collaborations to Widen Access and Build Talent Pipelines
- June 2025: The Aspen Group partnered with the National Foundation for Ectodermal Dysplasias, launching the Smile Bridge program to provide no-cost care through Aspen Dental and ClearChoice Dental Implant Centers.
- March 2025: Espire Dental (Denver) partnered with Zollege to run 12-week dental assistant training programs out of Espire’s Lakewood practices, turning clinics into training hubs while addressing staffing gaps.
Significant Structural & Operational Challenges
One of the biggest friction points for DSOs is the cost and complexity of integration when onboarding new practices.
Every acquisition requires investment in:
- Converting data and systems into the DSO’s preferred tech stack
- Training clinical and administrative teams on new software, workflows, and KPIs
- Upgrading infrastructure to meet enterprise security, privacy, and interoperability standards
Additional constraints include:
- Workforce shortages: Difficulty recruiting and retaining dentists, hygienists, and front-office staff
- Data privacy & security expectations: Increased compliance and cybersecurity burden
- Clinical autonomy concerns: Fear of lost decision-making control under corporate ownership
- Regulatory oversight: State-level corporate practice of dentistry rules shaping ownership and governance
How Patients Pay Is Changing
Financial pressure meets consumer behavior
Payment Mix Evolution
Latest Market Baseline (2024): Private Insurance
- Still the dominant payment method
- Critical for access but operationally complex
- Requires accurate eligibility, estimates, and communication
Fastest-Growing Payment Type (2025–2034): Out-of-Pocket / Self-Pay
- Driven by cosmetic dentistry and elective procedures
- High-deductible plans shifting cost to patients
- Patients behaving more like consumers
What This Signals for Practices
Practices must clearly explain value, costs, and expectations or patients delay, decline, or drop off.
For benchmarks on rising financial pressure (e.g., 40% patients citing cost as care barrier), check CERTIFY’s Financial Pressure Index 2025™—data showing how unified payment solutions like CERTIFY Pay streamline eligibility, estimates, and collections to match modern expectations without silos.
Demographics Behind Demand
Who drives volume today vs. growth tomorrow
Patient Segments
Largest Revenue Segment (2024): Adults
- Restorative and preventive care
- Insurance coverage plus discretionary spend
Fastest-Growing Segment (2025–2034): Children & Adolescents
- Preventive-care focus
- Rising orthodontic demand
- High lifetime patient value
What this signals:
Retention, recall, and long-term engagement are as important as new patient acquisition.
2025 Practice Performance Benchmarks (Mid-Year)
56% of treatment plans are scheduled, but only 46% are completed.
Orthodontics reaches ~70% case acceptance because patients clearly understand the value and have flexible payment options. General dentistry must close this same gap.
The “empty chair” problem:
A 14.4% cancellation rate plus 6.2% no-shows across ~200,000 U.S. practices translates into billions in lost production every year.
DSO investor signal:
8–10% same-store growth is now table stakes. Increasingly, valuations are driven by tech stack standardization, data visibility, and operational consistency, not just top-line growth.
| Metric | 2025 Average | Red Flags / Opportunity |
|---|---|---|
| Treatment Plan Completion | 46% | 56% accepted → 10% drop-off = millions in lost revenue |
| New Patients / Month | 47 | 39% of practices see <19 → stagnant growth pipelines |
| Cancellation Rate | 14.4% | +6.2% no-shows = “empty chair” crisis |
| Hygiene Reappointment | 65% (within 12 months) | Strong baseline, but can’t sustain growth alone |
| Ortho Case Acceptance | 70% | Benchmark general dentistry should aim to beat |
| Same-Store Growth | Q1: 8.1% · Q2: 9.8% | Positive trend, but below investor expectations |
These aren’t just numbers – they’re daily fires burning Practice Managers, Front Desk teams, RCM staff, and DSO execs.
See exactly how the 14.4% cancellations, 10% drop-offs, and A/R drag play out in their workflows below.
The Operational Reality Behind the Numbers
From market trends to daily execution
Growth looks strong on paper but delivering it depends on how effectively dental teams manage communication, scheduling, payments, and follow-ups every single day.
Day‑in‑the‑Life
Practice Manager – Day-in-the-Life
Time Blocks: Pre-Clinic | Morning | Midday | Afternoon | End of Day
Activities: Schedule review → Production check → Staff coordination → Treatment plan follow-up → A/R reconciliation
Tools: PMS reports, spreadsheets, phone/voicemail, basic analytics
Pain Points: No-show gaps in high-value slots, eligibility surprises delaying cases, staff jumping between 5+ tools
KPIs: Chair utilization %, no-show rate, production vs target, days in A/R Automation
Automation Impact: Real-time eligibility flags, auto waitlist fill, unified dashboards cut no-shows <10%
Dentists – Day-in-the-Life
Time Blocks: Pre‑Clinic | Morning | Midday | Afternoon | End of Day
Activities: Schedule review → Patient exams → Treatment discussions → High-value procedures → Documentation
Tools: PMS, imaging, chairside education tools
Pain Points: Patients delaying decisions due to confusion or cost uncertainty; inconsistent explanations across team
KPIs: Case acceptance %, production per day, treatment completion rate
Automation Impact: Unified patient communication, visual treatment explanations, upfront estimates improve acceptance and trust
Front Desk / Scheduler – Day‑in‑the‑Life
Time Blocks: Opening | Morning Rush | Midday | Afternoon | Close
Activities: Check‑ins & calls → Scheduling & insurance checks → Payments & forms → Reschedules & reminders → Next‑day prep
Tools: Phones, PMS, reminder tools, payment terminals
Pain Points: Phone overload; manual reminders; patient frustration over costs
KPIs: No‑show rate, call volume handled, same‑day collections
Automation Impact: Two‑way texting, self‑scheduling, digital payments reduce call burden and improve patient experience
RCM / Biller – Day‑in‑the‑Life
Time Blocks: Start of Day | Claims Processing | Midday Review | Follow‑ups | End of Day
Activities: Eligibility checks → Claim submission → Denial work → Patient balances → A/R review
Tools: PMS, clearinghouse, payer portals
Pain Points: Eligibility errors, denied claims, delayed patient payments
KPIs: Clean claim rate, days in A/R, patient balance recovery
Automation Impact: Real‑time eligibility, upfront estimates, digital payment links reduce rework and accelerate collections
DSO Leadership – Day‑in‑the‑Life
Time Blocks: Morning Review | Midday Check‑ins | Strategy | Performance Review | Planning
Activities: Review dashboards → Location check‑ins → Growth planning → KPI analysis → Expansion planning
Tools: Reports, BI dashboards, spreadsheets
Pain Points: Limited visibility across locations; inconsistent patient experience; reactive decision‑making
KPIs: Same‑store growth, no‑show trends, A/R aging, patient retention
Automation Impact: Unified analytics across locations; standardized communication workflows; scalable patient experience consistency
Technology Adoption in Dental Practices
Dental practices are accelerating software investment. The global dental practice management software market reached USD 3.1B in 2025 and is projected to grow to USD 8.2B by 2035 (10.3% CAGR).
In the U.S., adoption is moving even faster. Cloud-based dental practice management is growing at 10.5% CAGR, with 80%+ of practices now using cloud systems, led by multi-clinic groups and DSOs
What Software People Are Using Today
Market reality: The dental software landscape is fragmented across multiple point solution
| Software Category | Market Share | Key Players | What It Does |
|---|---|---|---|
| Web-Based PMS | 43.6% of revenue | Dentrix, Eaglesoft, Open Dental, CareStack, Tab32 | Scheduling, charting, basic billing |
| Patient Communication | 32.6% of revenue | Standalone reminder tools, texting platforms | SMS reminders, email notifications, basic engagement |
| Insurance Verification | Fragmented across RCM tools | Clearinghouses, eligibility checkers | Manual or semi-automated benefit checks |
| Payment Processing | Embedded in PMS or standalone | Stripe, Authorize.net, practice-specific gateways | Card-on-file, online payments, financing |
| Revenue Cycle Management | Fragmented point solutions | Clearinghouses, denials mgmt tools | Claims submission, follow-ups, A/R tracking |
The problem: A typical practice juggles 5–7 separate software systems, each requiring:
- Separate login credentials
- Manual data re-entry between systems
- Inconsistent patient records
- No unified visibility into what’s working
The Adoption Paradox: High Spend, Persistent Problems
| What Practices Prioritize | What's Actually Solved |
|---|---|
| 83% cite data security compliance as critical | ✅ HIPAA/GDPR checks enforced |
| 76% demand EHR/insurance system integration | ❌ Integration still manual or incomplete |
| 72% plan AI and cloud upgrades | ⏳ Implementation delays due to legacy systems |
| 89% cite software affordability as a top barrier | ❌ Multiple tools = higher total cost of ownership |
The result: Practices invest in tools that promise efficiency but operate in silos, leaving your core pain points unsolved:
- No-shows still hit 14.4–20% despite appointment reminder software
- Treatment plan completion still drops 10% from acceptance to completion (56% → 46%)
- Eligibility errors persist because verification is manual across disconnected systems
- A/R drags beyond 30 days because denial management and patient collections are fragmented
- Patient financial surprises still occur despite online portals, because upfront estimates aren’t unified across intake → scheduling → check-in
Why Current Software Falls Short: The Integration Tax
| Barrier | Key Issue | Why It Matters |
|---|---|---|
| Legacy System Lock-in | 40%+ of practices run on outdated, hard-to-integrate software | Slower adoption, higher costs, delayed ROI |
| The “Workflow Tax” | Staff use 5–6 disconnected systems daily | High admin overhead, burnout, low tech ROI |
| AI Adoption Gap | U.S. 63% vs Japan 27% vs India 35% adoption | Tech-forward practices pull ahead |
| Staffing & Training | IT demand +15% annually; limited in-house support | Slower rollouts, resistance to change |
“Tech stack standardization is the hallmark of a good organization, and it is a value signal to acquirers.” – Private equity leader, cited in Planet DDS 2025
The pattern is clear:
$175B market + $3.1B software spend should = operational excellence.
Instead, fragmented tools waste 5–10% of revenue daily.
Unified platforms change this equation.
CERTIFY Health delivers intake → eligibility → communication → payments in one workflow across 100+ PMS/EHRs, closing the 56→46% gap while standardizing DSO ops.
Ready to capture your share?
Closing the Gap: Your Next Steps
- Required unified platform across all locations (not 5–7 point tools per clinic)
- Real-time KPI dashboards showing no-shows, A/R, case acceptance across portfolio
- Standardized workflows so patients get the same experience at location A and location
- Automated eligibility & estimates so cost surprises don’t crater case acceptance
- Unified analytics to identify and scale best practices
CERTIFY Health solves this: Their unified platform integrates intake → eligibility → communication → payments → post-visit workflow across 100+ PMS/EHRs, eliminating 5–7 tool fragmentation. Real-time verification, two-way texting, and portfolio analytics cut no-shows, close care gaps, standardize DSO ops. delivering the investor-grade visibility practices need.
Take action now:
- See unified patient journeys live → Schedule Demo with Our Experts
- Download Tech Adaptation Guide 2026
- Download CERTIFY Insight Doc:
Fragmented tech = fragmented results. Unified platforms = unified growth.
References:
- https://www.towardshealthcare.com/insights/us-dental-services-organization-market-sizing
- https://www.globenewswire.com/news-release/2025/11/07/3183844/0/en/U-S-Dental-Services-Organization-Market-to-Drive-USD-196-5-Billion-Growing-at-17-9-CAGR-by-2034.html
- https://www.planetdds.com/wp-content/uploads/2025/08/2025-Mid-Year-Dental-Industry-Outlook-072525-1.pdf
- https://www.futuremarketinsights.com/reports/dental-practice-management-software-market