Table of Contents
Executive Snapshot
The U.S. dermatology market size tops $550M in 2025, fueled by a 7.3% CAGR amid surging demand from 50M acne cases, 7.5M psoriasis patients, and rising skin cancer incidence. Yet practices face acute pressures: 35-40 day wait times drive 15-20% patient leakage, 12-30% no-show rates waste capacity, and 14-20% denial rates, 3x industry norms, cost billions in rework and lost revenue.
Fragmented tech stacks (5-7 silos) exacerbate inefficiencies, from manual prior auths (7-14 days) to outdated fee schedules leaking $17K-$60K/provider monthly. PE consolidation accelerates, with platforms at 12-15x EBITDA vs. independents’ 4-9x, demanding unified EHR/PMS/RCM for scale.
2026 Imperative: Adopt integrated platforms for <8% denials/no-shows, real-time eligibility, ePA, and teledermatology to reclaim margins, improve NPS >50, and achieve 8%+ same-store growth. CERTIFY Health unifies workflows, slashing admin burdens and enabling thriving ops.
Dermatology Market Size & Structure In 2025
U.S. Dermatology Services Market at a Glance
U.S. Dermatology is a $552M+ market with explosive growth (acne alone affects 50M individuals annually; 7–8% CAGR in cosmetic and medical dermatology drives consumer demand).
Yet practices bleed revenue through access delays, prior authorization challenges in dermatology practices, and fee schedule mismanagement, costing the sector $billions annually.

| Dermatology Market Segmentation | 2024–2025 Value | 2030–2034 Projection | CAGR |
|---|---|---|---|
| Dermatology Services Revenue | $552M | $769.7B (global) | 7.3% |
| Dermatological Drugs (U.S.) | $12.28B | Growing through 2030 (JAK inhibitors, novel therapies) | 8–10% |
| Global Dermatology Market | $472.6B (2025) | $769.7B (2034) | 5.1% |
| U.S. Skin Clinics | ~4,965 clinics (2024) | Consolidating into platforms | — |
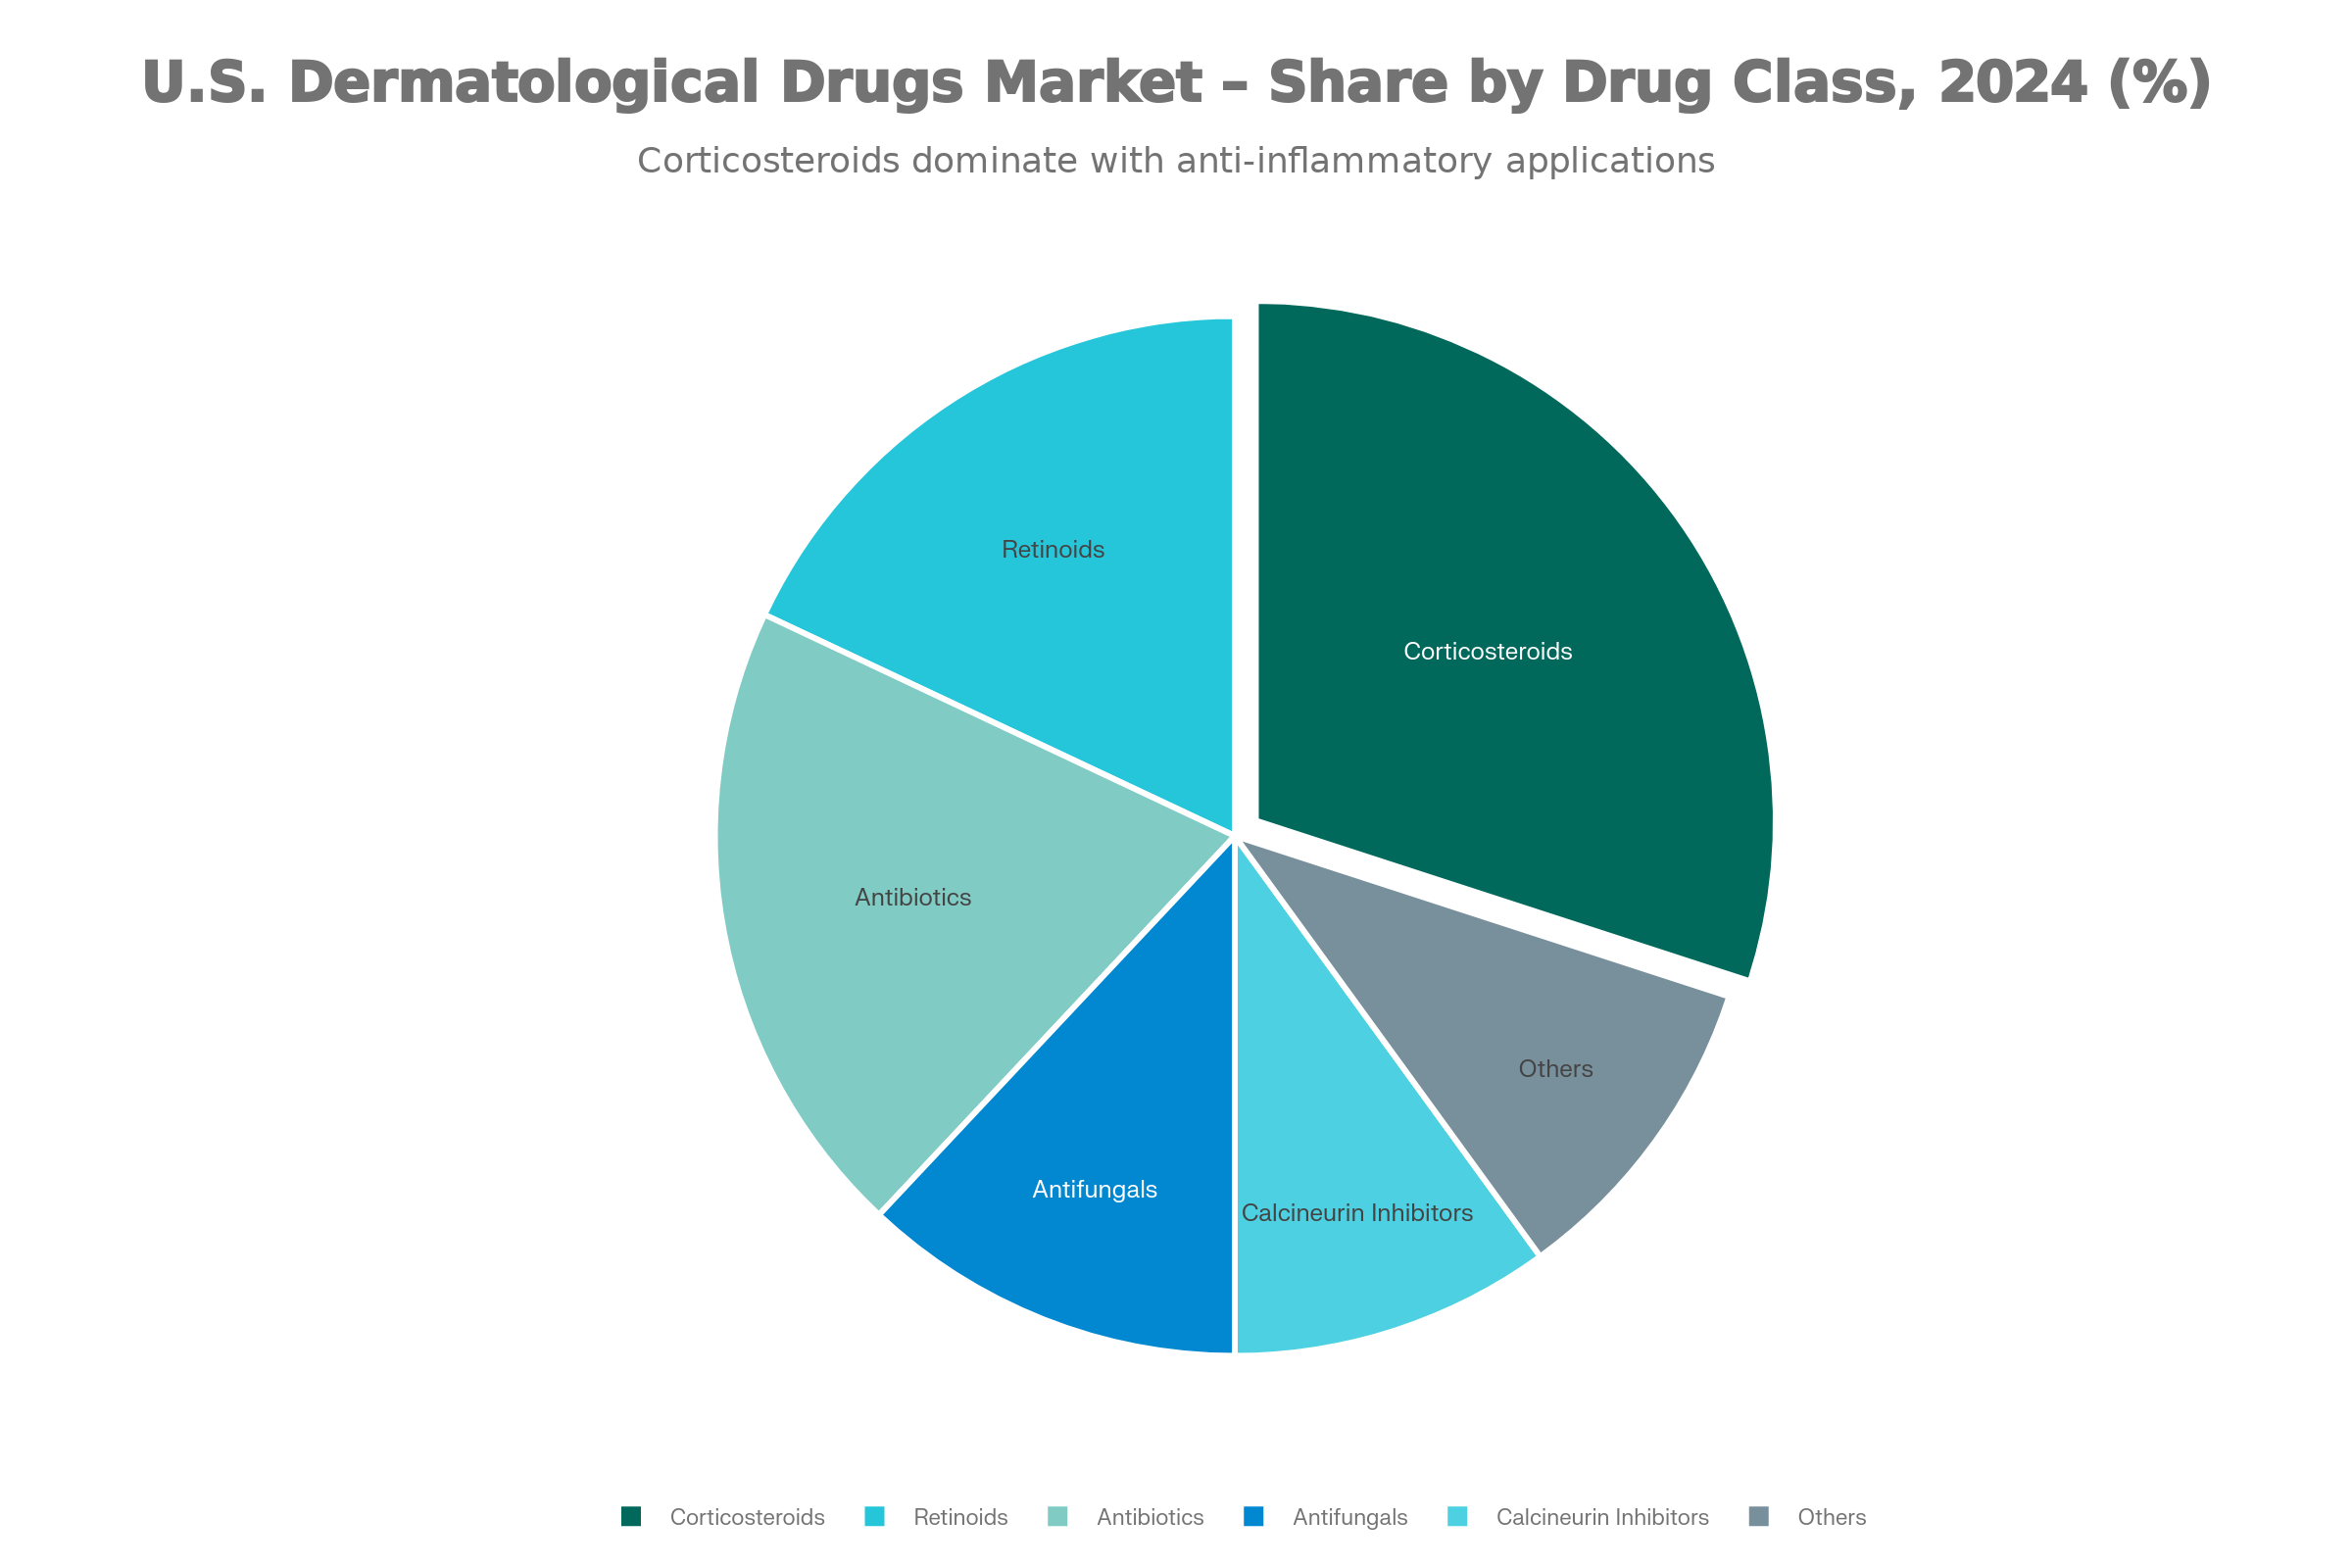
U.S. Dermatological Drugs Market Composition
| Dermatology Market Segmentation | Global Market (Data Bridge) | U.S. Market (Grand View Research) |
|---|---|---|
| By Disease / Therapy Area | Acne, Dermatitis, Psoriasis, Skin Cancer, Others | Acne, Psoriasis, Rosacea, Alopecia, Others |
| By Drug Type / Prescription Mode | Prescription drugs, Over-the-counter (OTC) | Prescription drugs (largest share ~77%), OTC |
| By Drug Class | Corticosteroids, Astringents, Anti-inflammatory & Antipruritic, Anti-infective, Antifungal | Retinoids, Antibiotics, Antifungals, Calcineurin inhibitors, Others |
| By Route of Administration | Topical, Oral, Parenteral (injectable) | Topical (largest ~60%), Oral, Parenteral |
| By Distribution Channel | Hospital pharmacies, Retail pharmacies, Online pharmacies | Retail pharmacies (largest ~50%), Hospital pharmacies, Others |
| By End User | Hospitals, Specialty dermatology clinics, Cosmetic & aesthetic centers | Primarily outpatient dermatology clinics and pharmacies |
| Regional Insight | North America largest market; Asia-Pacific fastest growth | U.S. is a major contributor to North America’s dominance |
Demand Drivers & Patient Behavior
Epidemiology & Patient Prevalence
Dermatology demand is driven by tens of millions living with chronic skin conditions, rising cancer incidence, and growing cosmetic demand. The table below shows the conditions shaping volume, complexity, and revenue across practices today.
| Condition | Annual Prevalence / Affected Population | Clinical Burden | dermatology market trends |
|---|---|---|---|
| Acne | ~50M individuals ; 85% of ages 12–24 experience some form | Largest segment with high social and psychological impact | Growing due to pollution and stress |
| Atopic Dermatitis | 16.5M adults , 9.6M children; 6.6M moderate-to-severe; 30% anxiety/depression | High cost of systemic therapies; steroid phobia reduces compliance | Rising in urban and high-pollution regions |
| Psoriasis | ~7.5M U.S. adults (~3% prevalence) | Chronic inflammatory disease with significant quality-of-life impact | High healthcare utilization due to long-term management |
| Melanoma & Skin Cancer | ~100K new cases annually ; mortality rising | Early detection critical; continuous imaging surveillance | Aging population and historical sun exposure |
| Hyperpigmentation & “Prejuvenation” | Melasma affecting ~5M in the U.S. ; prevalence up to 40% | Time-intensive cosmetic consults, mostly elective and self-pay | High demand, frequent follow-ups, variable outcomes |
Practice Economics, Consolidation & Workforce
Supply-Demand Imbalance & Staffing Crisis
- Dermatology demand remains strong across medical and cosmetic care, while supply stays relatively fixed.
- The U.S. has ~11,000+ practicing dermatologists, with shortages more pronounced in rural and secondary markets.
- Recruitment pressure is rising due to retirements, limited residency slots, and growing patient volumes.
- PE-backed groups often win talent with higher compensation, signing bonuses, and centralized recruiting, widening the gap with independents.
Consolidation and Private Equity
- Dermatology is among the most active specialties for PE investment in 2024–2025.
- Independent practices continue to decline as PE-backed platforms and roll-ups expand.
- Platform practices command 12–15× EBITDA multiples, compared to 4–9× for standalone practices.
- Consolidation increases negotiation power with payers and vendors, while shifting decisions around operations, IT, and purchasing to centralized teams.
- Technology buying increasingly favors enterprise-grade, scalable systems over point solutions.
Cost Structure and Profitability Pressures
- Practice operating costs have risen ~39% when adjusted for inflation.
- Staffing is the largest cost driver, fueled by wage inflation and workforce shortages.
- Medicare physician reimbursement has declined ~33% in real terms since 2001, despite a modest 2% increase in 2025.
- High-cost equipment (lasers, devices) and compliance overhead add margin pressure.
- Practices with a strong cosmetic or cash-pay mix show higher profitability and valuation resilience.
What This Means for Dermatology Practices
- Scale and efficiency now directly impact profitability and long-term value.
- Workforce strategy, service mix, and technology decisions are no longer optional, they’re economic survival levers.
- Practices that modernize operations and diversify revenue are best positioned to compete, independent or PE-backed.
Regulatory, Reimbursement & Coding Landscape 2025
Expect Tighter Margins and Higher Efficiency Demands
With CMS finalizing a 2.83% cut to the Physician Fee Schedule ($32.3465), the fifth straight year of reductions, core dermatology procedures are paying less. Skin biopsies (CPT 11102) now reimburse ~$50–$60, and Mohs surgery averages ~$300 per stage, making operational efficiency and case mix critical to sustaining profitability.
Stay Current or Risk Denials and Audits
FDA approvals of 8 new dermatology drug indications (including chronic hand eczema and plaque psoriasis) and new ICD-10 codes such as L66.11–L66.19 (scarring alopecia variants) and L40.0 (psoriasis vulgaris), require EHR updates to maintain accurate CPT–ICD crosswalks. Documentation standards for biopsies (11102–11107) and excisions (11400–11646) are stricter; missing lesion size, margins, or rationale can trigger $200–$500 per-claim recoupments, audits, and penalties.
Quality Reporting Is Getting Simpler, But Unavoidable
The Dermatological Care MVP (ID: M1421) is voluntary in 2025 and likely mandatory by 2029. It reduces admin burden (4 quality measures + 1 claims-based population health measure vs. 6 in traditional MIPS) and focuses on dermatology outcomes like psoriasis itch severity and melanoma tracking. Hitting the 75-point threshold avoids up to 9% penalties and aligns well with procedures such as phototherapy (96910).
Compliance Risk Is Rising Across The Board
Expect heightened payer scrutiny of modifiers (-25, -51), more prior authorizations for Mohs and Botox for hyperhidrosis, and tighter oversight following major HIPAA breaches (1.9M patients affected in 2025).
Updated CLIA/CAP lab director rules (board certification and training) and OIG audit findings (improving E/M compliance but persistent overpayments) underscore the need for disciplined workflows.
Clinical & Technology Trends Reshaping Dermatology
Practice Tech Stack Priorities (2025)
Practices investing in:
- EHR/PMS Consolidation – Reducing 5–7 point solutions to 2–3 integrated platforms
- Instant eligibility verification with ePA, shrinking prior auth wait times from weeks to days
- Teledermatology Infrastructure – Store-and-forward, real-time consultations for access relief
- AI Diagnostic Support – Skin lesion classification to aid non-specialists (NPs, PAs)
- Engage patients and get paid faster with two-way texting, paperless intake, and seamless point-of-service payments
Overview: The Three Core Archetypes
Your dermatology practice ecosystem hinges on three interdependent groups:
- The Operational Hub – Practice Manager, Scheduler, Front Desk
- The Clinical Engine – Provider, Clinical Director, Medical Assistant, Mohs Tech
- The Financial Backbone – RCM Manager, Biller, Prior Authorization Specialist
Each faces distinct pressures; bottlenecks in one cascade across all three. Below are compressed day-in-the-life snapshots for your ICPs.
Dermatology Practice Personas Summary
| Persona | Role Overview | Key Activities / Focus Areas | Top 3 Pain Points | Strategic Priorities | Core Metrics | Automation Impact |
|---|---|---|---|---|---|---|
| Practice Manager / Director of Operations | Senior administrative leader managing multi-site operations, staffing, budgeting, and tech performance. | Daily schedule reviews, staff coverage checks, revenue & denial tracking, tech uptime analysis, multi-site standardization. |
1. Revenue leaks from fee schedule gaps 2. High no-show rates 3. Fragmented workflows |
- Lower no-shows (<8%) - Maximize fee schedules - Standardize workflows - Improve staff retention |
No-show <8%; Denial <8%; Growth 7–10%; Retention >90% | Unified comms + RCM automation → recovered $17k–$60k/provider/month. |
| Provider (Dermatologist, NP, PA) | Clinical expert focused on diagnosis, procedures, and patient education. | Patient exams, procedures, charting, prior auth reviews, follow-ups. |
1. Admin overload 2. Low compliance 3. Diagnostic complexity |
- Cut documentation time 30% - Compliance >70% - PA decisions <24h |
Docs <10 min; Accuracy ~100%; Acceptance >80% | AI-driven ePA + denial prediction → fewer interruptions. |
| Clinical Support Staff (MA / Mohs Tech) | Hands-on clinical operations and patient support. | Rooming, assisting procedures, documentation, post-op communication. |
1. Unpredictable workflows 2. Documentation errors 3. Anxious patients |
- Rooming <10 min - Documentation 99%+ - Satisfaction >85% |
Rooming <10 min; Prep <15 min; Accuracy 99%+ | Digital intake + SMS → smoother flow, less stress. |
| RCM Manager / Billing Lead | Manages billing, denials, coding, and payer relationships. | Claims submission, denial management, fee optimization, cash forecasting. |
1. High denial rates 2. Complex coding rules 3. Outdated fee schedules |
- Denials <8% - A/R <35 days - Net collections >96% |
Clean claims >95%; Appeal wins >70% | AI coding + validation → higher first-pass rates. |
| Prior Authorization Specialist | Handles payer approvals for high-cost treatments. | Submit PAs, manage appeals, patient updates. |
1. Heavy PA volume 2. Long appeal cycles 3. Treatment abandonment |
- Approvals >85% - Turnaround <48h - Abandonment <5% |
Approval >85%; Appeals >70% | Automated ePA → faster approvals & better comms. |
| C-Suite / VP Operations | Oversees profitability, growth, and enterprise strategy. | Performance reviews, acquisitions, tech roadmap. |
- Patient access leakage - Data silos - Value-based care transition |
- 8% same-store growth - Unified workflows - ROI <18 months |
NPS >50; Denials <8%; Growth >8% | Unified analytics → scalable growth + faster ROI. |
2025 Benchmark Realities
| Metric | Typical 2025 Performance | Risk Signals / Upside Potential | Best-Practice Benchmark |
|---|---|---|---|
| Time to Appointment | ~5–6 weeks for routine skin checks | Access delays drive patient drop-off and postponed care | Best-in-class: under 6 weeks |
| Missed Appointment Rate | ~12–30% (some locations spike to 25–30%) | Roughly double the healthcare norm, causing lost capacity | Industry norm: ~5% |
| Prior Authorization Cycle | Turnaround ranges from days to multiple weeks | Disrupts clinical flow and delays treatment start | Goal: completed within 48 hours |
| Claims Denial Rate | ~14–20% | Nearly 3× standard levels; $25–$50 per claim in rework costs | Industry average: ~5% |
| Appeal Win Rate | ~60–80% | Up to 40% of denials remain unpaid, eroding revenue | High performers: >80% |
| Accounts Receivable (Days) | ~40–45 days outstanding | Constrains cash flow and increases aged balances | Target: under 35 days |
| Fee Schedule Maintenance | Updated infrequently (every 2–3 years) | $17K–$60K in missed revenue per provider per month | Leading practices: yearly updates |
| Patient Cost Visibility | ~30–50% adoption despite NSA rules | Surprise bills frustrate cosmetic & self-pay patients | Best practice: 100% upfront estimates |
| Mohs Workflow Efficiency | ~2–4 hours total; complex cases 4–8 hours | Long waits cause dissatisfaction, burnout, and slot leakage | Optimal: <2 hours average |
| Telehealth Utilization | ~40–50% (up from ~15% pre-2020) | Independent clinics trail PE-backed groups | Target: >70% where clinically appropriate |
Technology Adoption: The Fragmentation Paradox
Dermatology's Software Spend Paradox
Market Reality: Dermatology invests in:
- Cloud-based Dermatology EHR Software (Allscripts, NextGen, Medidata)
- PMS platforms (Medidata, Plexus, Greenway)
- Telehealth software for dermatology (LiveHealth Online, Teladoc, proprietary platforms)
- Prior auth/clearinghouse services (Emdeon, Change Healthcare, payer portals)
- Patient engagement software (Zocdoc, patient portals)
- AI diagnostic tools (DermaSensor, SkinVision)
The Problem:
Each system is a “silo.” A typical dermatology practice juggles 5–7 disconnected systems, each requiring:
- Separate login credentials
- Manual re-entry of patient data (eligibility, demographics)
- Inconsistent patient records across systems
- No unified visibility into which tool is solving which problem
What Dermatologists Prioritize vs. What's Actually Solved
| Practice Priority | What’s Promised | What’s Actually Solved | Gap |
|---|---|---|---|
| EHR / PMS Integration | 85% cite as critical | 40% have true integration (auto data sync) | Manual workarounds persist |
| Prior Auth Automation | 78% want to reduce PA burden | 20% have true ePA (embedded in EHR) | Most still rely on payer portals and manual submission |
| Teledermatology | 70% invested or planning | Adoption varies: 40–50% depending on payer mix | Limited payer coverage; documentation burden remains |
| AI Diagnostic Support | 65% see potential | 10% actively using in clinical workflow | Image quality, training, and liability concerns delay adoption |
| Patient Cost Transparency | 60% recognize importance | 25% have true upfront estimates integrated with claims data | Fragmented systems cause manual, inaccurate estimates |
| Real-Time Eligibility | 80% demand | 30% have true real-time verification | Most verify day-of-appointment or reactively |
Current Tools Don’t Cut It: Paying the Price for Poor Integration
| Barrier | Key Issue | Why It Matters |
|---|---|---|
| Legacy System Lock-in | 35–40% of practices operate on older, hard-to-integrate PMS | Slower adoption, higher implementation costs, delayed ROI |
| The Workflow Tax | Staff juggle 5–7 disconnected systems daily | High administrative burden, burnout, low perceived tech ROI |
| Data Quality Issues | Manual re-entry across systems creates inconsistencies | Eligibility failures, billing errors, patient frustration |
| Payer Integration Gaps | Fragmented payer portals with no unified ePA standard | Slow PA submission and persistently high denial rates |
| Staffing & Training | IT demand growing ~15% annually with limited in-house support | Slower rollouts, staff resistance, under-utilized technology |
Net Result: Dermatology practices spend $50K–$200K annually on software but remain operationally inefficient. Unified platforms change this equation.
Patient Experience, Access & Digital Front Door
The Access Crisis Paradox
Market Reality: Dermatology demand is surging:
- Acne affecting 50M Americans annually
- Cosmetic demand up 8–12% YoY
- Aging population driving skin cancer screenings
- Social media amplifying skincare consciousness
Practice Reality: Supply can’t keep up:
- 6-month average wait times (some metros longer)
- 10% no-show rates (broken appointments = wasted capacity)
- Staffing shortages (dermatologists, MAs, Mohs techs)
- Operational inefficiencies (Mohs scheduling, slow check-in)
Result: 15–20% patient leakage (go to competitors, retail clinics, telehealth alternatives)
Digital Front Door Priorities (2026 Focus Areas)
| Priority | Current State | Target (2025–2026) | Impact |
|---|---|---|---|
| Online Scheduling | 50–60% of practices offer | 85%+ with real-time availability and waitlist management | Reduce phone volume by 40% and accelerate appointment fill |
| Digital Intake | ~40% of practices | 80%+ with pre-arrival forms auto-verified in EHR | Check-in under 10 minutes with first-pass data accuracy |
| Instant Eligibility & Cost Visibility | ~30% | 75%+ tightly linked to scheduling and intake | Upfront cost clarity reduces surprises and improves collections |
| Two-Way Communication | ~50% adoption, mostly SMS reminders only | 85%+ across SMS, email, and patient portal | Lower no-shows, better compliance, higher satisfaction |
| Telehealth (Appropriate Cases) | ~40–50% | 70%+ for initial consults, follow-ups, and post-op care | Expanded access, reduced travel burden, improved experience |
| Point-of-Service Collections | ~40–50% | 80%+ via digital check-in and automated post-visit follow-up | Faster same-day collections and stronger cash flow |
Note: Practices adopting CERTIFY Pay typically see POS collections jump to 80%, thanks to digital or POS payments at check-in and automated post-visit follow-ups, driving faster same-day cash flow.
Outlook To 2026–2030 & Strategic Recommendations
Practices thriving by 2026 will have:
- Unified tech stack (single EHR/PMS/RCM, not 5–7 systems)
- Denials under 8% (improved from current 14%)
- No-show rate below 8%
- Instant eligibility checks and upfront cost visibility
- Teledermatology setup to expand patient access
- Active revenue optimization (annual fee schedule refresh, payer contract
Strategic Priorities by Practice Type
For Independent Dermatology Practices (40–50% of market)
2026 Priorities:
- Simplify tech: Combine PMS, EHR, and RCM into a few integrated platforms
- Attack Denial Rate – From 14% → <10% (hire/train dermatology-specialist biller; implement ePA if available)
- Optimize Fee Schedules – Annual update + active payer negotiation = recover $17K–$60K monthly per provider
- Reduce No-Shows – Implement predictive scheduling + automated two-way patient communication = target <8%
- Build Access Relief – Teledermatology for appropriate cases; extended hours; multi-location scheduling if group
- Workforce Strategy – Invest in retention (competitive comp, clear growth paths, lighter admin burden) or hire strategic NPs/PAs
Why This Matters: Without action, independents risk:
- Losing 20–30% of addressable market to PE-backed competitors in next 5 years
- Continued denial rate pressure eroding margins
- Staff burnout + turnover limiting growth
- Lower valuation if contemplating PE sale (tech stack maturity is now a key valuation driver)
For PE-Backed Groups & Multi-Location Operators
2026 Priorities:
- Standardize Operations Network-Wide – Unified EHR, PMS, RCM across all locations; consistent patient experience
- Drive Same-Store Growth >8% – Optimize scheduling, reduce no-shows, improve patient satisfaction (NPS >50)
- Keep Denial Rates Under 8% Across Your Network – Centralized RCM with dermatology-focused billing at scale
- Invest in Teledermatology + AI – Build infrastructure for store-and-forward consults + future AI diagnostic tools
- Expand Service Mix – Add injectables/cosmetics to high-margin revenue; bundle with medical dermatology
- Prepare for Value-Based Care – Hire data analysts, care coordinators; build population health capabilities for PMPM contracts
Why This Matters: Private Equity Firms Now Place Higher Value On:
- Tech stack maturity & integration (ePA, unified RCM, analytics)
- Portfolio-wide operational alignment
- Same-store growth of 8%+ as baseline
- Denial rate performance (market leader = <8% vs 14% baseline)
- Infrastructure readiness for value-based care (future proof)
Closing The Gap: Your Next Steps
Required For Dermatology Practices to Thrive (2026)
- Unified platform across all clinical, financial, and patient communication workflows (not 5–7 disconnected point solutions)
- Real-time KPI dashboards showing no-shows, denial rates, A/R, patient satisfaction across portfolio (if multi-location)
- Standardized workflows so patients get consistent experience at location A and location Z (if group/PE)
- Automated eligibility & cost estimates upfront so financial surprises don’t crater case acceptance
- ePA (electronic prior auth) integration to cut turnaround from 7–14 days → <48 hours
- Proactive denial prevention (AI validation + root-cause analysis) to stop revenue leakage before it starts
- Teledermatology infrastructure (image quality standards, payer coverage mapping) to relieve access pressure
- Patient communication automation (pre/post-visit education, appointment reminders, post-op follow-up) to reduce no-shows + improve compliance
Certify Health Solution
Why Dermatology Practices Are Turning to Unified Platforms
Dermatology practices invest heavily in practice management software but operate in silos, leaving core pain points unsolved:
- 14% denial rates persist despite dermatology billing software
- 6-month wait times and 10% no-shows despite scheduling systems
- Prior auth turnarounds >1 week despite payer portals
- Fee schedule optimization failures cost $17K–$60K monthly per provider
- Patient cost surprises persist despite online portals, because upfront estimates aren’t unified
The Solution: CERTIFY Health’s unified healthcare platform that brings patient experience, practice management, patient management, RCM & Billing, and Integrations into a single platform delivering unified journey from intake → eligibility → communication → payments → post-visit workflows in one unified platform, integrated across 100+ EHRs/PMSs, closing the gap in treatment plan completion while standardizing dermatology practice ops.
What CERTIFY Delivers for Dermatology
Real-time Eligibility – Upfront patient cost visibility at scheduling, intake, check-in (not reactive)
Unified Patient Communication – SMS, email, portal for pre/post-op education, appointment reminders, post-op follow-up (reduces no-shows, improves compliance)
Integrated ePA Support – Electronic prior auth submission (when available) + ePA-ready workflows; reduces turnaround, minimizes provider interruption
Proactive Denial Prevention – Real-time claim validation + denial prediction stops denials before they happen
Portfolio Analytics – Real-time dashboards across 2–20 locations showing denial rates, no-show trends, A/R aging, patient satisfaction
Automated Collections – Digital payments at check-in, post-visit payment links, unified balance tracking
Dermatology-Ready Workflows – Medical vs cosmetic distinction, Mohs procedure tracking, specialist-friendly documentation
Take Action Now
- Experience unified patient journeys in real time → Schedule Demo with Our Experts
- Download: Tech Adaptation Guide 2026 – Dermatology
Key priority areas for technology modernization in dermatology practices
- Download CERTIFY Insight Doc:
References:
- https://practicaldermatology.com/issues/september-2025/preparing-for-private-equity-benefits-and-dr…
- https://www.curemelanoma.org/blog/over-104-000-americans-estimated-to-be-diagnosed-with-invasive-me…
- https://www.stifel.com/Newsletters/InvestmentBanking/BAL/Marketing/Healthcare/HealthcareServices/20…
- https://practicaldermatology.com/issues/september-2025/preparing-for-private-equity-benefits-and-dr…